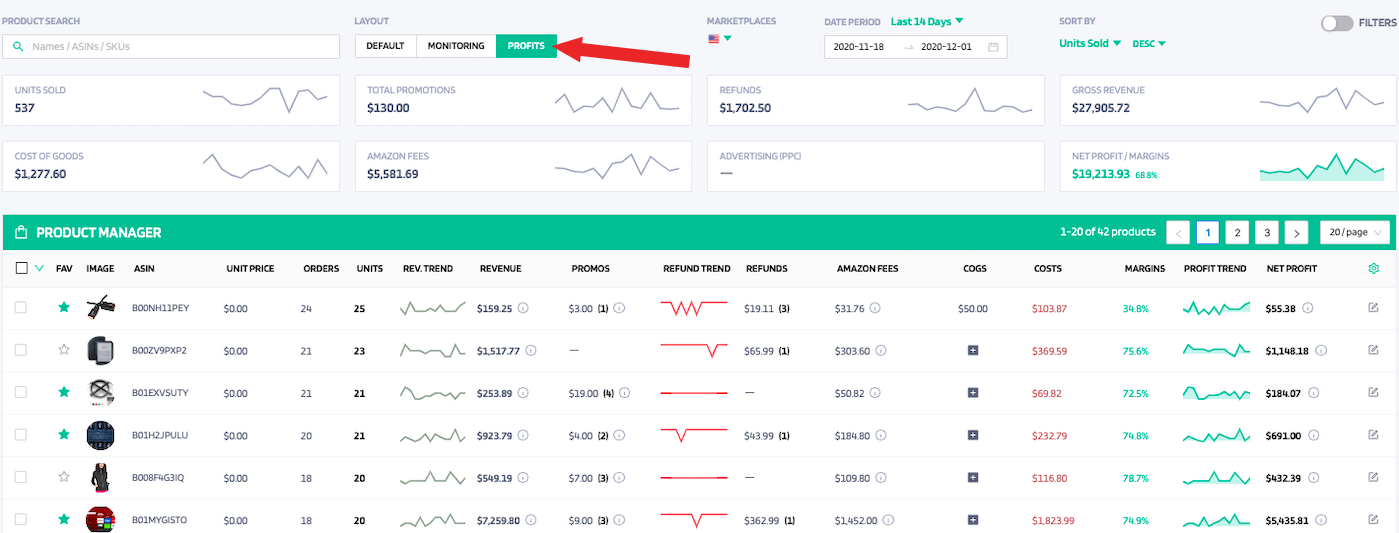
The Profits page can be located inside your Product Manager page by clicking on the "Profits" tab OR going to https://app.feedbackwhiz.com/profits/products This page allows you to view, analyze, and manage all your profits data on the SKU/ASIN level
You have the ability to Customize Columns that are displayed by clicking the settings icon on the right corner as pictured below: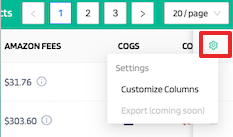
You can choose the following columns to display such as product details, sales data, profit and loss, and graphs.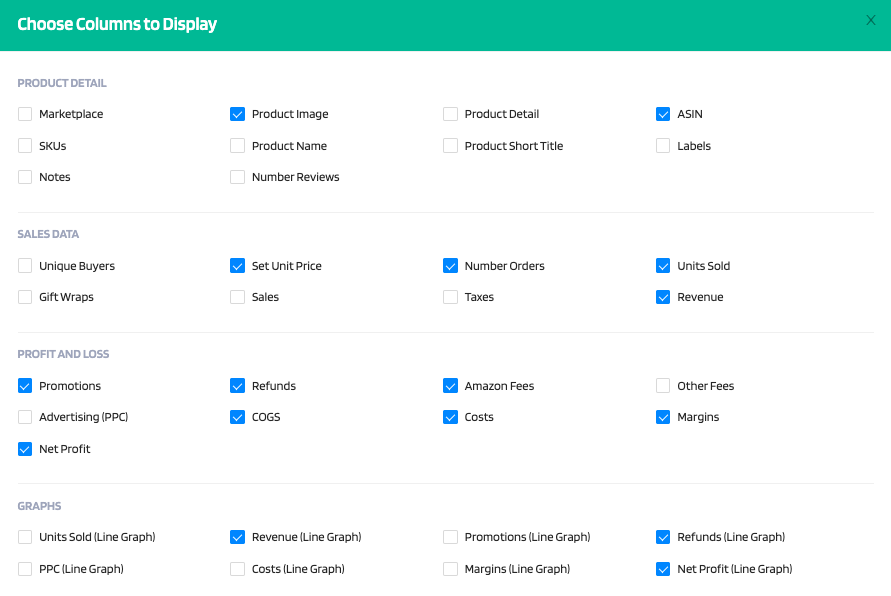
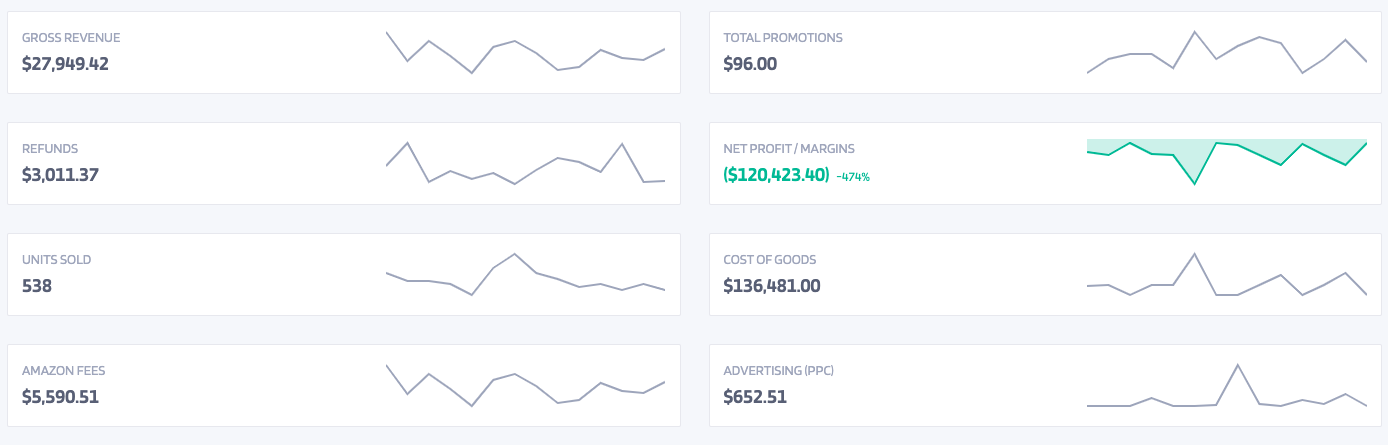
The Profits Page provides an overview of aggregate data of all filters selected for your Gross Revenue, Total Promotions, Refunds, Net Profit/Margins, Units Sold, Costs of Goods, Amazon fees, and Advertising (PPC).
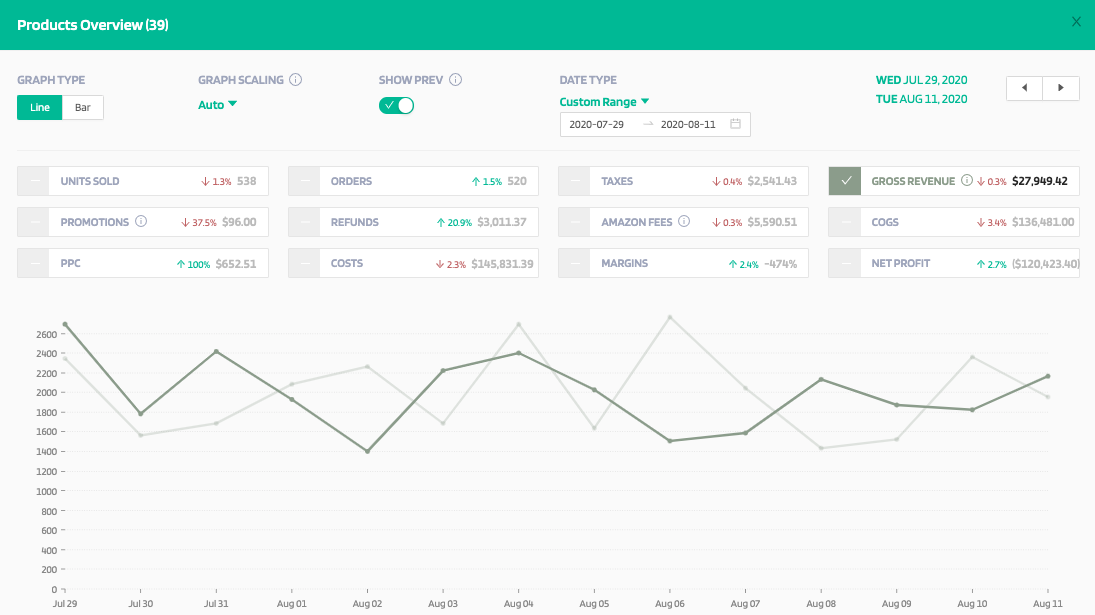
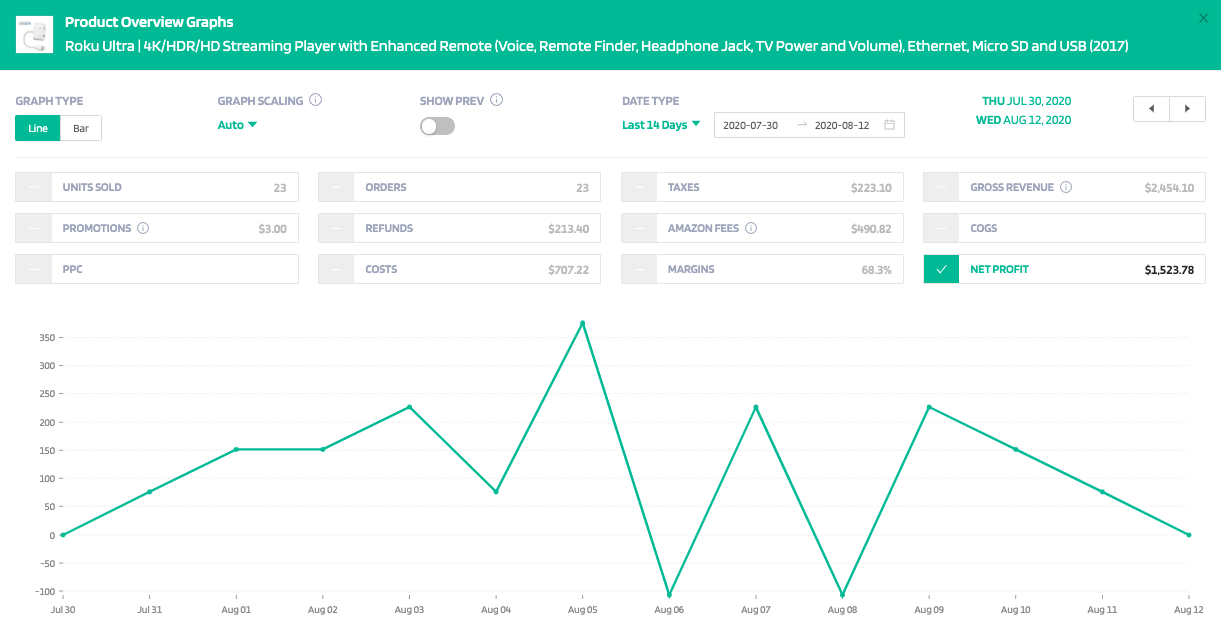
You can click on any graph and a pop up will appear with the "Products Overview"
Graph type: Line or Bar.
Graph Scaling: Auto, Linear, Percentage, Max Value.
Date Type: Custom Range, By week, By Month, Last 7 days, Last 14 days, Last 28 days, Last 30 days, Last 60 days, Last 90 days, Last 180 days, Last 365 days, MTD, QTD.
Show Prev: Compare currently selected lines with date range selected.
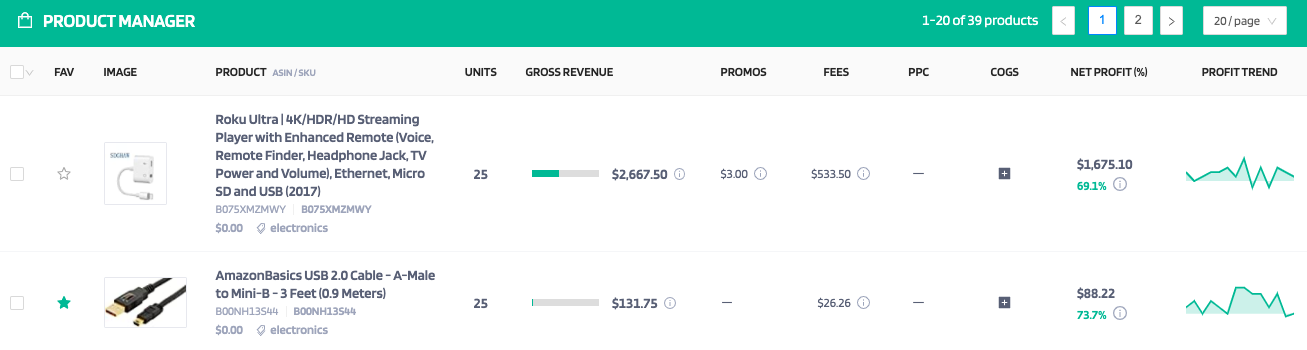
The Product Manager will break down in detail for the ASIN level. You can see Units sold, Gross revenue, promos, fees, COGS, Net Profit(%), and Profit Trend.
The Amazon Fees: FBA Order Fulfillment, FBA Unit Fulfillment, FBA Weight Based, Commission, Fixed Closing, Variable Closing, Sales Tax Collection, Shipping Chargeback, Giftwrap Chargeback, COD Chargeback, Shipping Holdback, Giftwrap Commission, Refund Commission, Technology, FBA Delivery Services, Amazon Exclusives, Get Paid Faster, CSBA. (Not ALL fees will apply to you)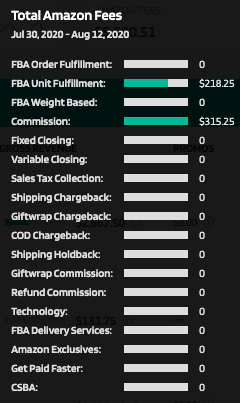
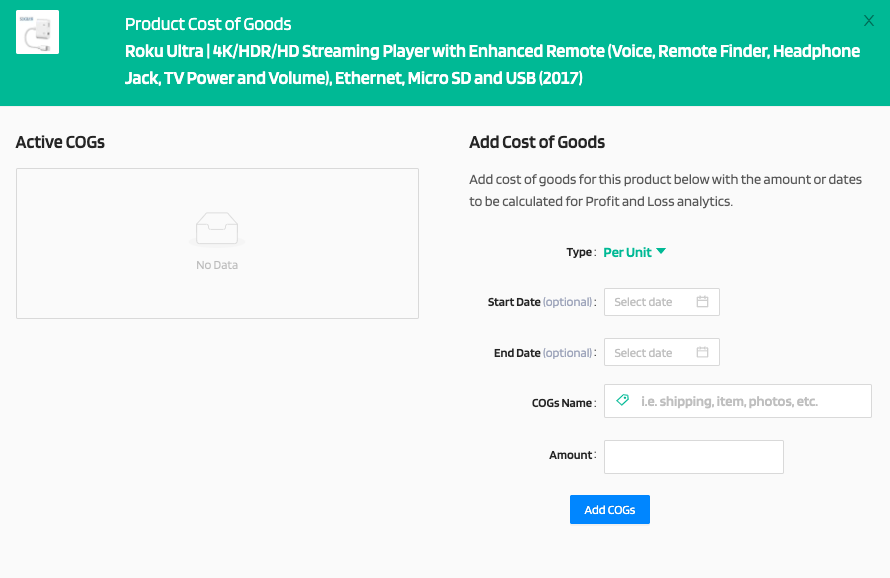
For Cost of Goods, you can click on the "+" button for a pop up to appear. Within the COG's you can enter in ANY cost for the product.
For the Profit Trend, you can click on the graph for the Product Overview graph to pop up. This Graph will break it down by the product. The Graph will display Units Sold, Promotions, PPC, Orders, Refunds, Costs, Taxes, Amazon Fees, Margins, Gross Revenue, COGs, and Net Profit.
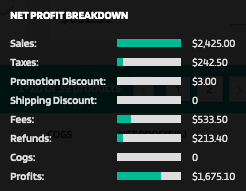
The Net Profit Breakdown: Sales, Taxes, Promotion Discount, Shipping Discount, Fees, Refunds, Cogs, Profits.